Remember all of those authority figures? Those experts who you could always trust, the clergy for their command of ethics and mortality, the teachers for their mastery of knowledge, the scientists for their prowess in … well … science of course, the physicians for their skills in all things medical and of course the journalists … ha ha! just kidding no one has ever accused them of being experts.
All of these professions have taken hits, the exposures of numerous pedophiles, zealots, frauds and quacks have ruined our confidence in experts leaving us in a vacuum of confidence. For me some of those hits occurred 50 years ago when I noted that some professors followed the money, not the data. I realized that even pious science could be corrupted, so when I noticed incongruities in what I was being told, I had to find ways to uncover the truth for myself.
One great incongruity has been the peril of sea level rise. Ecoxperts howl that within 20 years climate change will melt Greenland and Antarctica flooding low lying islands and coastlines creating millions/billions of refugees who will be displaced into neighbouring countries causing mayhem. However, those 20 years have already passed and the seas have stayed put. Rather than issuing an apology for a failed hypothesis, the flexperts have updated their prediction with unmitigated mayhem another 20 years out. If they update the prediction every 10 years with another 20 years before calamity, the donations and grants keep on rolling in.
There are of course many others who say it ain’t so. Ok, the oceans are indeed rising, but slowly, the rise has been going on for a long time but at a rate that shouldn’t worry anyone.
One doesn’t have to pick sides, you can look the data up for yourself and that it what I have done just because I like to know the truth.
The National Oceanography Center keeps a record of sea level gauges around the world and SONEL keeps records of vertical land movements.
Sea levels are constantly changing and they are therefore measured frequency and the heights are then averaged. Here is an example of a tide gauge measurement from Victoria BC:

The measurements of sea level go back to 1909 and go up to 2017, more data have been added since I processed this graph. The data points in millimetres, show a wide scatter as sea level changes with onshore breezes, currents and water temperature. To make the graph clearer the data can be smoothed over a 12 month interval:

The yellow line through the data points is a line of best fit and it shows a change from 6948 mm in 1909 rising to 7025 mm in 2017, a total increase of 77 mm or a little over 3.0 inches over 109 years. That is 0.706 mm per year, the thickness of a dime.
This may be caused by a changing climate, slowly warming oceans after a Little Ice Age in the 18th and early 19th centuries and there is a uniformity of rise from the early 20th century until now. Somehow, sea level rise has stayed constant despite great increases in the emissions of industries and automobiles.
Of course one tide gauge is one tide gauge, but there are thousands more, including”

and
Both of these tidal gauges show slowly rising, non-accelerating graphs. Graphs measured over more than a century, predating the great increases in CO2 emissions.
Most tidal gauges show similar slow steady increases but there are exceptions with some gauges showing large rises and some even showing falls. One complication is that the land on which the tidal gauge sits can also be rising or falling due to tectonic forces. Rising land will show smaller sea level rises and falling land will show greater sea level rises. To correct for these tectonic effects, I looked at tide gauges that are close to geophysical stations that measure vertical land movements.
Here is a graph of measured sea level rises corrected for vertical land movemnents for the West Coast of North America:

One would expect sea level rise to be similar over the interconnected oceans of the world what with liquids seeking a common level, however this may be complicated by the inaccuracies of measuring tiny vertical land motions and the effects of changing temperature, salinity, and current on the expansion and density of water.
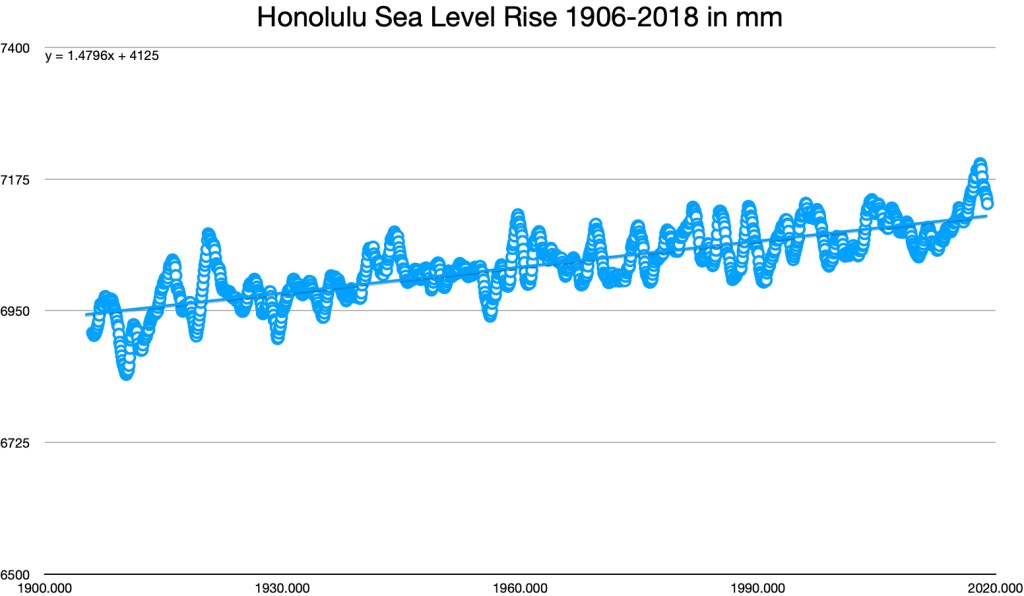
The above graph calculates average yearly sea level rise for 31 stations running from Alaska to Mexico with more equatorial measures from Hawaii and the Galapagos. Although there is a range from a -1.5 mm decrease to a 4.8 mm increase there is reasonable agreement on a sea level rise of between 0.5 to 2.8 mm per year with a median of 1.5 mm per year.
Similarly I repeated this task for the East Coast of North America:

For this graph of 29 stations from Labrador to Miami and beyond, the sea level rise averages 1.9 mm per year with most data points lying between 1.3 and 3.0 mm per year. Reasonably good agreement with the West Coast data.
But that is not enough. I then surveyed the tide gauges of Europe:

There are 26 tide gauges ranging from the UK down to Gibraltar that are close to measurements of vertical land movements. The average sea level rise is 1.9 mm per annum with most data points lying between 1.1 and 2.6 mm per annum. Again very good agreement with both the East and West coasts of North America.
A total of 86 tide gauges that give similar measures of sea level rise over the vastness of two oceans. An increase that has been fairly constant over the last century at about 1.9 ± 0.7 mm per annum. The consistency of the rise over a century in by far most data sets argues that this is a normal and natural warming of the world with none of the acceleration caused by CO2 driven climate change. Even so, the sea level rise does not seem alarming. A 2.0 mm yearly rise portends an increase of 20 mm per decade or about 0.8 inches sea level rise every 10 years. At this rate it would take 500 years for the seas to rise by 1.0 meters or 39.4 inches.
In an increasingly wealthy world with cheap energy the costs of protecting low lying areas from flooding would be minuscule spread over 500 years, increasing the height of berms, adding riprap or increasing pump volumes.
In a world gone crazy where inconveniences are deemed existential threats and wealth is redistributed by ecozealots with social and political agendas, Climate Change does become an existential threat but the change in climate has little to do with it.

Leave a comment