Excess Mortality 2: Covid, Vaccines and Excess Deaths
R. McCarter
At a glance:
- In the 5 months following the first wave of Covid deaths there appear to be 3,900 excess deaths caused by the restrictive Covid measures implemented by health ministries.
- During the last half of 2021 there were about 7,400 excess deaths that cannot be explained as Covid related. I estimate that about 4,400 of these deaths were caused by restrictive health measures and 2,900 of the deaths were caused by the vaccines.
- For two long periods, one 20 week period following the use of the vaccines and one 12 week period following the January 2022 Covid wave, there were 10,000 more Covid deaths than there were excess deaths. It would appear that Covid deaths were exaggerated by at least 27%.
- By taking the exaggeration into account it would appear that 60.5% of excess deaths were from Covid and 17,500 excess deaths or 39.5% were caused by other factors, probably restrictive health measures and vaccinations.
- The timing of the surplus Covid deaths suggests that the exaggeration was used to frighten people into taking their shots.
- The BCCDC (British Columbia Centre for Disease Control) appears to be actively trying to hide that the vaccines are ineffective.
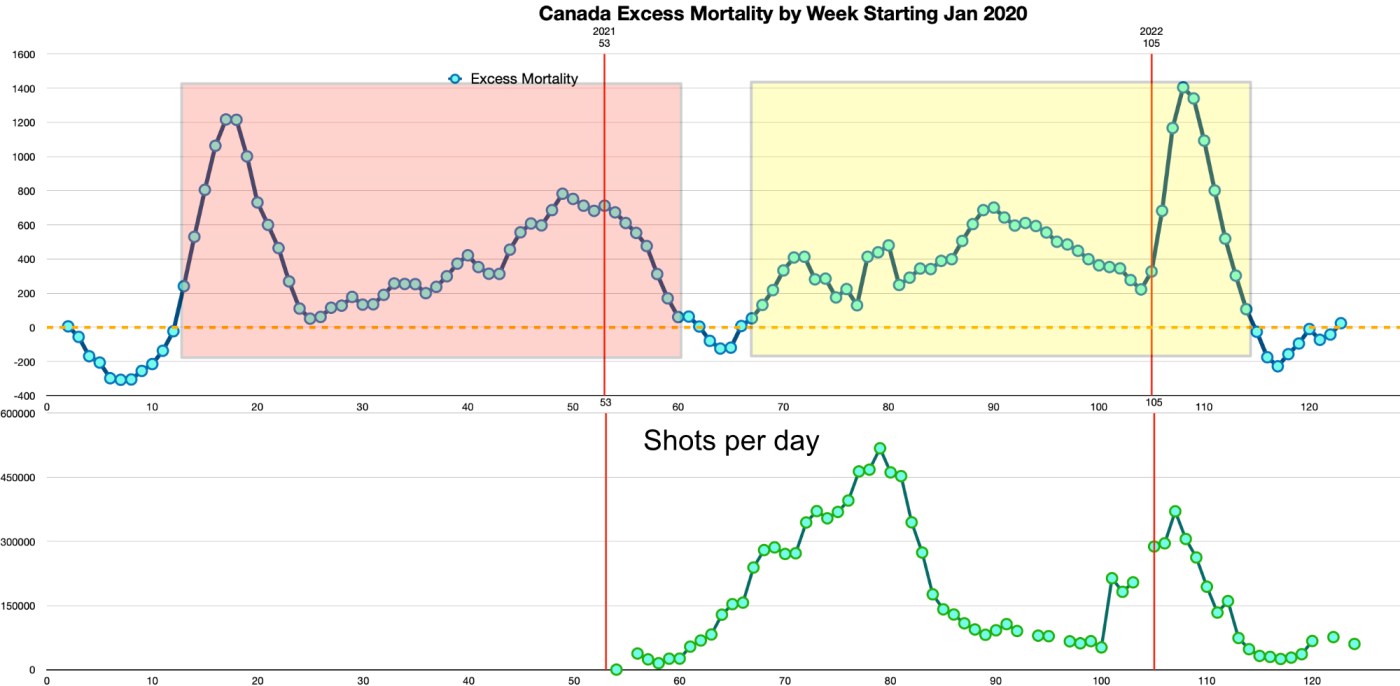
In the previous article, the Statscan excess mortality for Jan 2020 through May 2022 was compared to the daily number of mRNA vaccinations (data from Public Health Agency of Canada, PHAC) in this graph:

And it appeared that there was not a lot of payback for the 85 million shots that Canadians had to endure. When divided into equal intervals, there were 3.8% more excess deaths in the 48 week period with vaccinations (yellow) than there were in the earlier 48 weeks of the Covid only period (pink).
This raises the question of whether the billions used to buy and distribute vaccines were a waste or whether there were some benefits.
To look for possible benefits, the following graph compares weekly excess mortality with weekly Covid deaths:
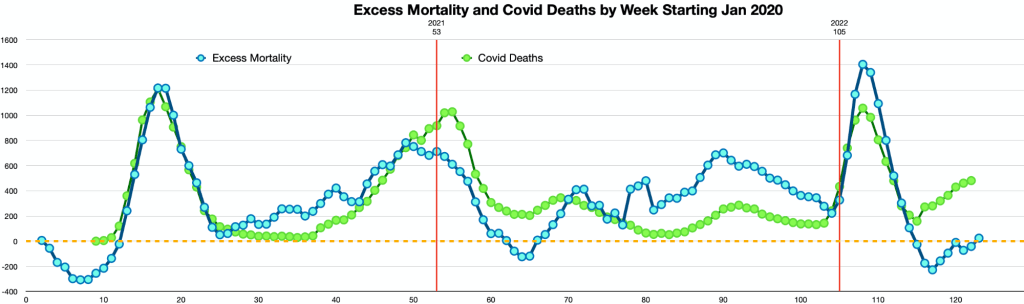
The blue line is the weekly excess mortality and the green line is the weekly Covid deaths as reported by Our World in Data. The data is smoothed over three week intervals to lessen random fluctuations and make patterns more evident.
Did the lockdowns and other measures used to prevent the spread Covid cause an increase or decrease in mortality?
It would be reasonable to assume that the excess mortality observed over the past two and a half years would have been caused by Covid deaths and indeed that seems to be the case for the first wave between weeks 13 and 26. During this first wave the excess mortality of 8,459 closely matches the 8,679 Covid deaths over the same period.
However, following that first wave, the excess deaths consistently exceed Covid mortality for 22 weeks starting with week 28 in mid July running to week 49 in early December, 2020. This surplus indicates that there is another emergent cause of excess mortality. This increased mortality appears too consistent to be random variation and, unable to imagine any other prolonged causes, is most likely due to the lockdowns and other measures used to control Covid.
There is a possibility that the excess deaths are due to residual health issues following Covid, however, continuing health problems should produce a diminishing curve of excess deaths following the first wave. Instead, the excess deaths show a gradual increase even as Covid deaths remain near zero.
Over these 22 weeks there are 7,805 excess deaths and 3,909 Covid deaths (50%). Therefore, I estimate that over these 5 months, there could be 3,900 (2 sig digits) Canadians who died from overzealous public health restrictions.
Did the mRNA Vaccinations Cause Excess Deaths?
There is another long period when the excess mortality consistently exceeds the number of Covid deaths and that is from week 80 through 104. During this half year from mid July to the end of December, 2021, during which many Canadians got their booster shots, there are 11,183 excess deaths of which 3,814 can be explained by Covid mortality, leaving 7,369 excess deaths due to unknown causes. If the same ratio of deaths holds as in the earlier example, weeks 28-49, there would be 4,427 deaths due to public health restrictions, leaving 2,900 (2 sig digits) deaths that may have been caused by the mRNA vaccinations over just 25 weeks.
Are the numbers of Covid deaths exaggerated?
Explaining why the Covid deaths would match the excess mortality or why there are fewer Covid deaths than excess mortality is fairly straightforward, however, it is more difficult to explain why the Covid deaths exceed the excess deaths and do so for extended periods.
Over weeks 50 through 69, mid December 2020, to late April 2021, there were 11,255 reported Covid deaths compared to an excess mortality of 5,782. There are an extra 5,473 Covid deaths that somehow did not contribute to excess deaths.
During weeks 113 to 124, from the end of February to mid May 2022, Covid deaths again exceeded excess mortality. In these 12 weeks, there were 4,187 reported Covid deaths and a deficit in normal mortality of -323, an extra 4,510 Covid deaths that did not increase excess mortality.
Where did these excess Covid deaths come from?
The only way the Covid deaths can exceed excess deaths is if some of the normal expected deaths, people who are going to die of other causes, are being included as Covid deaths or that somehow Covid is reducing the death rate from the usual causes.
Throughout Covid times there were reports that influenza had all but disappeared and other indicators that death from pneumonia had also decreased. This could be the result of physicians writing off these respiratory diseases as the more fashionable Covid or that Covid actually does suppress the flu.
The next graph shows the peak months of flu activity from 1983 to 2022:
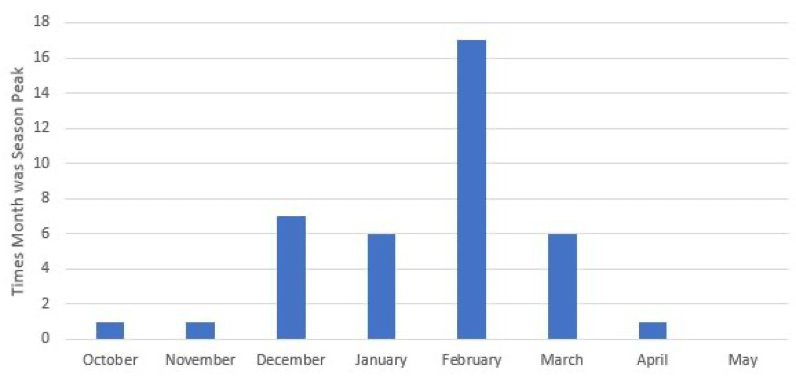
If Covid does suppress the flu this should be most evident in December through March. The first period of Covid excess runs from late December to late April; the second bout of Covid excess is from the end of February until mid May. Although this suppression of influenza cannot be ruled out as causing some of the discrepancy, the runs of excess Covid deaths seem too long, too late, too convenient and too consistent to only be caused by lessening the flu.
There are more ignoble reasons why the Covid mortality could exceed the excess mortality. Some health agencies including the BCCDC had policies like this:

A Covid fatality was anyone who had tested positive within 30 days prior to their death no matter what actually caused their death. So a person with heart problems is admitted to hospital, tests positive and four weeks later dies of coronary thrombosis – Covid? Check!
The following graph groups Canada’s Covid deaths by age group:

Fully 92.7% of all Covid deaths were people over 60 years old. Only 1.2% of all Covid deaths were those younger than 40 years old.
It should be no wonder that, by far, most Covid deaths were among the old and infirm, these were the people most likely to die in the 30 days following a Covid diagnosis whatever the cause.
With the above information I would have to go with, “Yes, the Covid deaths were exaggerated”, probably by 5,500 deaths between weeks 50 to 69 and another 4,500 deaths from weeks 113 to 124. That is an exaggeration of 10,000 deaths in just 32 weeks out of the 120 weeks of Covid. An exaggeration of 27% of the reported 36,900 Covid deaths up to May 14, 2022.
So if we reduce the number of Covid deaths by this 10,000 exaggeration, there are 26,900 Covid deaths out of 44,447 excess deaths or 60.5% of the excess deaths were caused by Covid. This also means that there are 17,500 unexplained excess deaths from mid March 2020 to mid May 2022, 39.5% of all excess deaths that could have been caused by restrictive health measures and vaccinations.
Why would anyone want to exaggerate Covid deaths?

The timing of the excess Covid deaths could be a clue as to why they were exaggerated. Covid deaths began to exceed excess deaths in the middle of December, 2020, coincident with the first availability of the mRNA vaccines, and the Covid deaths continued to exceed excess deaths for 20 weeks, weeks 51 through 70, until the number of shots per day were well on their way.
Could it be that the number of Covid deaths was being exaggerated as an incentive for people to get their shots?
But now it was time for the shots to look successful, so for a few weeks, weeks 71 to 77, the Covid deaths matched excess mortality then for weeks 78 through 103 the Covid deaths dropped below excess mortality.
With the January 2022 Covid wave it became obvious to the public that the shots were losing any effectiveness they might have had and by week 114 it became most people had stopped taking boosters and were not having their children vaccinated. The number of shots per day dropped precipitously and it became important to frighten us once again. By week 115 and continuing through week 124, the number of Covid deaths once again exceeded the total number of excess deaths – by up to 450 extra Covid deaths per week.
In BC the word spread that the vaccines were ineffective, for months the numbers of boosted stuck at about 52% and the numbers of unvaccinated stayed at about 14% despite the fear campaign. Over these months the BCCDC recorded that the doubly and triply vaccinated comprised 89-91% of all Covid related deaths.

Reality seems to have been too distressing for the BCCDC, a few months ago they stopped updating their Donut Charts, eventually posting this more inclusive chart:

Instead of one or two months, these charts cover almost a half year of data. The intent of reporting 6 full months of dats seems to be to lessen the appearance of total vaccine failure and to obscure short term changes in vaccine effectiveness. All this while looking like they are being open with the data.
A couple of months ago I asked the BCCDC to give me a link to the historical Donut data but have had no response.
Why are they hiding the data?
Summarizing:
- In the 5 months following the first wave of Covid deaths there appear to be 3,900 excess deaths caused by the restrictive Covid measures implemented by health ministries.
- During the last half of 2021 there were about 7,400 excess deaths that cannot be explained as Covid related. I estimate that about 4,400 of these deaths were caused by restrictive health measures and 2,900 of the deaths were caused by the vaccines.
- For two long periods, one 20 week period following the use of the vaccines and one 12 week period following the January 2022 Covid wave, there were 10,000 more Covid deaths than there were excess deaths. It would appear that Covid deaths were exaggerated by at least 27%.
- Taking the above exaggeration into account, Covid appears to have been responsible for 60.5% of excess deaths and other factors, including health mandates and vaccines for 39.5% of 44,447 excess deaths.
- The timing of the surplus of Covid deaths suggests that the exaggeration was used to frighten people into taking their shots.
- The BCCDC appears to be actively trying to hide that the vaccines are ineffective.
But there’s more! In part 3 of this series I will be looking at the Statscan mortality data to see what it tells us about excess deaths in different age groups. From this information we should be able to determine if the many public health measures or vaccines have been of benefit for any age group. We may also determine if these measures have been harmful.
