
R. M. McCarter
Excess Mortality 1: Lies, Damned Lies and Computer Models
Takeaways:
- There was an excess mortality of 44,447 Canadians, about a 7.6% increase, over the two+ years of Covid.
- Covid seems to be responsible for 83% of all Canadian excess deaths although the number of Covid deaths may be exaggerated.
- In the second year of Covid with people being vaccinated, there were 3.8% more excess deaths than in the previous year without vaccinations.
- Despite the PMs enthusiasm that the vaccines saved millions…billions of lives, it is doubtful that the vaccinations saved many Canadian lives.
Hate to disappoint by my blog is not as prestigious as The Lancet. But when The Lancet Infectious Diseases recently published a mathematical modelling study claiming that the mRNA vaccines saved over 19.8 million lives, I had to blink. The model calculated that vaccines prevented 4.2 million COVID-19 deaths in India, 1.9 million in the United States, 1 million in Brazil, 631,000 in France and 507,000 in the United Kingdom. Canada didn’t rate a mention, but it hasn’t stopped Justin claiming that the mRNA vaccines “saved millions … billions of lives”.
If the use of a computer model is supposed to add credence to the Lancet paper – it shouldn’t. Judging from the 30+ supercomputer climate models, each of which predicts different weather in our futures, the input parameters of models can be tweaked until you get the politically correct results. And if you were a politician today wouldn’t you want to show, in the most prestigious medical magazines of the day, that your bungling and ineptitude actually saved hundreds of millions of lives? Homage in those captured scientific journals could ward off all those metaphorical torches and pitchforks.
There have been several other authors who have claimed the opposite, that not only have the vaccines not saved lives, they have killed many thousands of the vaccinated. In this article I am going to try to figure out the actual numbers by looking at Statistics Canada’s Provisional deaths and excess mortality in Canada dashboard.
Mortality data has been catalogued for many years and shows consistencies from year to year. Any variations from the norm can show health concerns, for example if more people are dying during a heat wave, there will be a spike in deaths, if winter deaths rise, people may be having trouble paying their heating bills or there may be a deadly flu. Unlike the Covid data, the mortality data should be relatively uncontaminated by any sampling or political biases.
The first obstacle is this graph:

Which shows the number of weekly deaths that have occurred in Canada from 2014 until May 2022. Each colour is a different year.
Fortunately, each year can be separated out. The following graph is the weekly mortality for 2020:
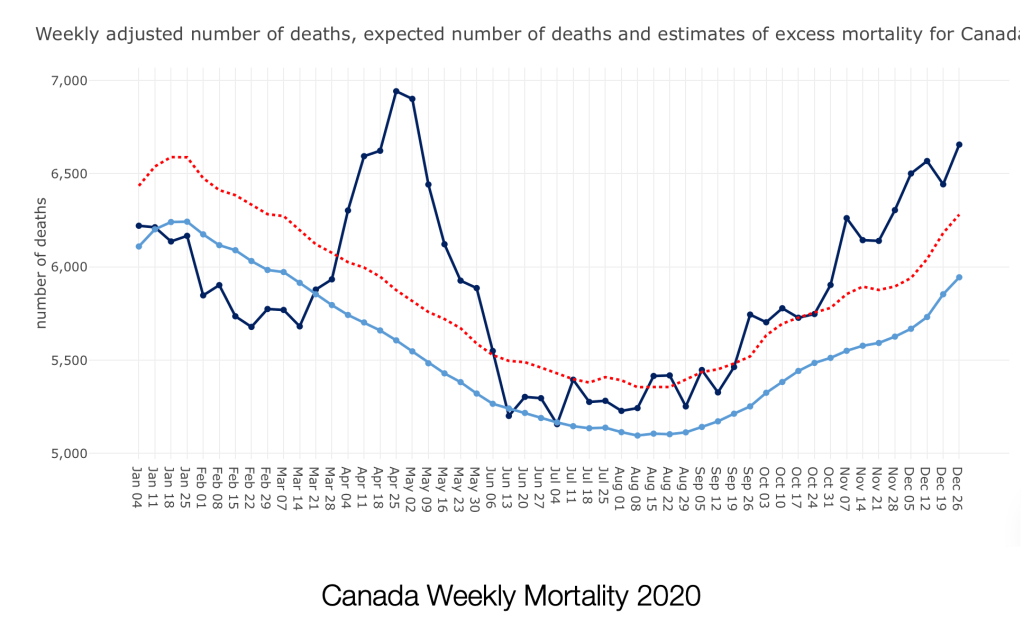
The blue line shows the expected number of weekly deaths based on the mortality in previous years. This expected number of deaths shows an annual variation with deaths highest in mid January and falling to the lowest death rate in late August; cold kills, warmth – not so much. The red dotted line is the 95% confidence limit; given the inevitable random fluctuations in data, 95% of the time the data points should fall below the red line. Any data points above the red line are unusual and a series of data points lying above the red line is a warning, indicating that some factor is causing increased mortality.
For 2020 the most obvious increase in mortality begins in mid March and peaks in early May at almost 7000 deaths per week, an excess of about 1600 souls per week. The mortality falls back to near normal rates by mid June. Following that low, the death rate rises again over several months, exceeding expectations and continuing into 2021:

The increase in mortality peaked in mid January 2021 then fell back to normal by mid February and remained low until late April. At the end of June there was a sudden spike in deaths caused by the heat dome in British Columbia. Following this spike, the mortality rate remained high, exceeding a 95% confidence, for the rest of 2021.
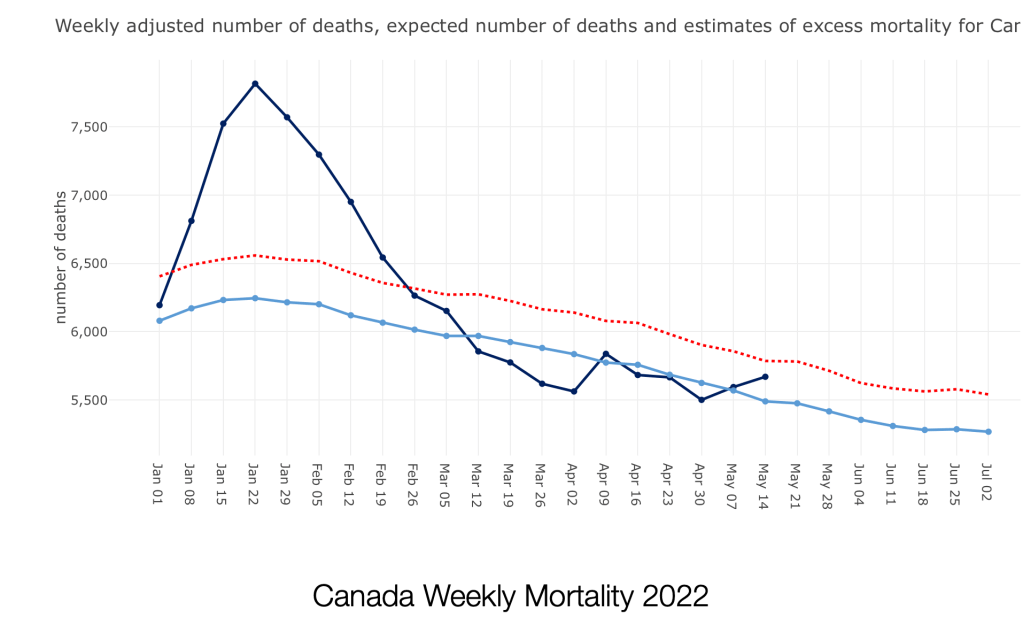
Starting in early January 2022, there was another large increase in mortality, reaching as high as 7,800 deaths per week, an excess mortality of about 1500 deaths. This excess mortality continued until the beginning of March, then from mid March to mid May mortality returned to normal.
The peaks in mortality over these past two and a half years are large and persistent. To better understand what has caused these increases, the expected mortality can be subtracted from the total mortality to show only the excess mortality:

The graph starts at the beginning of January 2020 with week one and continues until May 14, 2022, week 124. The data has been smoothed by grouping three week intervals to lessen random fluctuations. A horizontal yellow dashed line marks 0 or no excess mortality. Data points above the line show excess mortality and points below the yellow line show a deficit in mortality. Vertical red lines mark the first weeks of 2021 and 2022.
The graph allows us to answer a few questions:
What was the excess mortality during the first two years of Covid?
For the 2 years from week 12 (March 21, 2020) through week 115 (March 12, 2022) there is a persistent excess mortality except for a brief deficit in mortality around week 64 (March 20, 2021). Overall, from week 12 to week 115 there are 44,447 excess deaths during this period. Compared to the expected mortality of 584,736 over this same period, the excess deaths represent a large 7.6% increase in Canadians dying.
What percent of the excess deaths was caused by Covid?
Over these same 104 weeks, if the number of Covid deaths recorded is accurate, there were a total of 36,901 Covid deaths or 83.0% of all excess deaths. This would seem to leave 7,546 unexplained excess deaths in addition to those caused by Covid.
Were the vaccinations effective in lowering excess mortality?
This next graph compares excess mortality to the number of mRNA vaccines given per day:

Vaccinations began in the first few weeks of 2021, (week 55) and at the same time the number of excess deaths began to plummet. This is unlikely to be causal because by week 60 only 181,752 vaccinations had been given (0.5% of the Canadian population) and the excess mortality had already dropped to only 32 deaths per week.
Over the next 20 weeks the number of vaccinations greatly increased but so also did the number of excess deaths. Vaccinations peaked in week 79 (July 3, 2021) just as the BC heat dome caused a short term peak in excess deaths. Vaccination rate declined abruptly over the next 10 weeks even as excess deaths continued to rise as high as 700 excess deaths per week. After week 90 excess deaths continued on a slow decline until the end of the year.
Starting in week 101 (December 4, 2021) there was a Christmas resurgence in vaccinations peaking in the third week of 2022. Despite the increased number of vaccinations, mortality also took off, peaking at 1400 excess deaths per week in the fourth week of 2022 then abruptly decreasing to normal levels by week 11 of 2022 (March 12).
By some fluke, the data divides nicely into the Covid phase and the vaccination phase, each 48 weeks in length. These two nearly year long phases almost have a reverse symmetry, the Covid phase starting with a large amplitude short duration peak, the vaccination phase ending with a high, abrupt peak. The Covid phase began with an increase in excess deaths that started on week 13 and ended with a return to a near normal death rate in week 60. The vaccination Phase started in week 67 as excess deaths increased and ended in week 114 with a return to a normal mortality rate.
In the Covid phase there were 21,962 excess deaths and in the vaccination phase there were 22,802 excess deaths. From the data supplied by Statscan, the Vaccination phase had 3.8% more excess deaths than the Covid phase making it doubtful that the mRNA vaccinations saved any lives, and certainly was not even close to the millions – no billions of lives, credited by our PM.
Summing up:
- There was an excess mortality of 44,447 excess deaths between early March 2020 and mid May 2022, a 7.6% over increase in excess mortality over the two+ years of Covid.
- Covid seems to be responsible for 83% of all excess deaths although the second article in this series suggests that the number of Covid deaths may be exaggerated.
- In the second year of Covid with people vaccinated there were 3.8% more excess deaths than in the previous year without vaccinations.
- Despite authoritative protestations to the contrary, it is doubtful that the vaccinations saved many lives in Canada.
In the second part of this series I look at how the number of Covid deaths compares with the excess mortality of Canadians over the two+ Covid years.
