
I wrote this article last year when I thought things were quieting down. It is still highly relevant. If you have any doubts about the success or futility of using wind or solar energy to power modern high tech countries, the math lays out the realities.
Solutions for a ‘Zero Carbon’ Grid
R. McCarter
As all the foofaraw over other worldly events begins to ebb, a born again climate scare is quickly oozing back. Forget those oh so slowly rising seas, it is the fear of slowly rising carbon dioxide that threatens to swamp us.
While waiting for the Covid tide to go out I have been learning the wonders of spreadsheets and decided to apply my new talents to finding out if a ‘net zero’ electrical grid is possible or plausible. It is common to find advocates who laud the low and dropping costs of wind and solar, insisting that we tear up existing fossil and nuclear to replace them with cost-saving landscapes of panels, towers and whirling blades. Yet there are others who fault renewables for their intermittency and the need for expensive backup to supply electricity for several dark and becalmed days. These critics point out the quickly rising costs of electricity in countries with large renewable penetration.
So, who is right? Support for renewables seems to be everywhere, with a common consensus of main stream media and popular science magazines. Also, those sharpened minds of EU, UK, US, Australian and Canadian politicians all agree to damn the budgets and go pell-mell for ‘zero carbon’ – when you already have an intuitive solution you don’t have to do research. Despite the cognitive prowess of these sources, I lean towards the contrary views appearing on websites such as WUWT. These are usually well researched, written by authors with no chicken in the fight and with surprising expertise. But a common failing is the articles are complex with lengthy arguments that need some dedication and education to read and heed.
Leaning is not enough, especially when getting it wrong could have those ‘existential’ consequences. To understand how ‘net zero’ would affect economies and environments, I used recent data from Fraunhofer energy-charts.info on the German grid for the half year from August 31, 2020 – March 10 2021), data for electrical loads and wind and solar output. These data provide a real-world look at fluctuations in renewable power demand and supply. From the US Energy Information Administration (EIA 2020) I got information for capital costs, fuel costs, operating and maintenance and performance for different energy sources. Using this information I calculated approximate levelized costs of electricity and used them to compare solar to wind to natural gas to nuclear.
Germany has been a leader in renewable solar and wind energies with, at this time, 54.52 GW installed solar and 62.59 GW installed wind; a total renewable capacity of 117.11 GW to provide a grid that had a maximum load of about 76.4 GW over the past winter. This is a generous 53% reserve capacity, far above the recommended 15% excess for thermal electrical systems like nuclear, coal and gas. And yet with all that excess, Fraunhofer reports only 51% of electrical generation in 2020 from renewables, and that includes 12% from biomass and run-of-river. hydroelectricity.
Germany has even more generation capacity with 24.7 GW coal, 30.1 GW gas and 9.5 GW nuclear; with renewables a total of 217.5 GW of electrical capacity, a super generous excess reserve capacity of 185%. No wonder, with that much idling equipment, Germans pay some of the largest electrical rates in the world, USD $0.365/kWh in 2020. Over 3X the stepped rate of USD $0.0744¢ – $0.111/kWh where I live in BC, Canada.
Surely there are slimmed down, environmentally conscious, less costly infrastructures, that can power the needs of Germany. Working with my spreadsheet I looked for minimum ‘zero carbon’ solutions using solar and wind generation, adding battery storage if needed and as a last resort, even though Germany has a strong aversion, considered nuclear. The main criterion for a solution was the absence of zero days, days on which the energy supply would fail.
Present Wind and Solar
A starting point is the present capacity of wind and solar compared to the day to day expected loads.
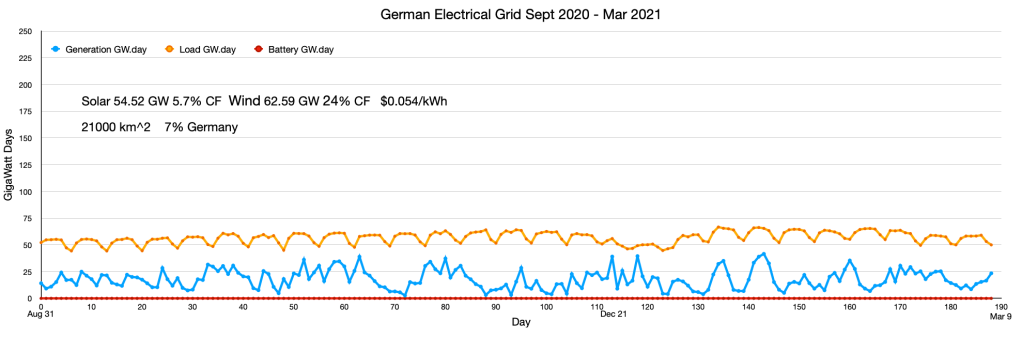
The orange humped plot is the daily load averaged for 0:00 o’clock low and 12:00 high loads, close enough for back of the envelop I think. The repeated low points along the orange line are low load weekends. The considerable drop in load between days 110 and 130 is over Christmas. The multi-peaked blue line is the combined solar and wind averaged for each day. Note that even with 117.11 GW of wind/solar capacity, daily generation doesn’t come near the 40 GW through 70 GW daily loads and there are 0 days in the half year that the electric grid would function on wind and solar alone. Using hydroelectric or battery storage would be of no use because there is never excess energy to reverse pump water or charge the cells.
Natural Gas
For reference I worked out my own levelized cost for electricity for natural gas. Yes it is a fossil fuel, yes it involves hydraulic fracturing, yes it is clean, abundant and presently cheap. The US has been closing down coal fired plants and replacing them with natural gas and in doing so has considerably lowered carbon dioxide emissions. Burning natural gas produces only about half of the CO2 produced by coal. Despite withdrawal from the Paris agreement, the US has with few exceptions kept electrical prices low and has lowered its emissions more than Germany, even though Germany is highly invested into renewables.
Natural gas usage does produce an energy security problem; unlike coal, natural gas cannot be stored in large amounts onsite and has to be constantly supplied by pipelines. The very word ‘pipeline’ produces illogical political knee jerks, but safety of piped gas is not the issue. In cold snaps, the pipeline may not have enough capacity to provide the electrical plant and there may be other customers who are increasing their natural gas usage. If the pipeline crosses borders, turning off valves may be used to leverage political disputes.
As before, the graph shows the load as a wavy orange line, the unwavering blue line is the production from 100 GW of installed CCGT.
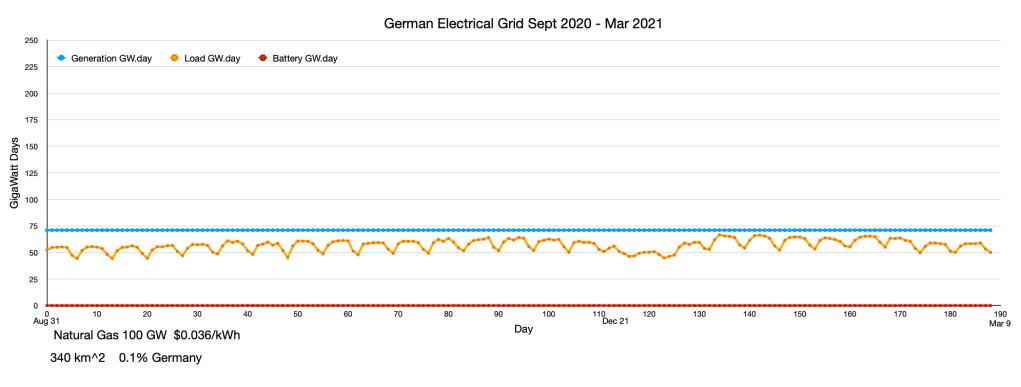
I have calculated using the most common CCGT turbines without carbon capture and without more costly peaking plants. Allowing for an expected 71% capacity factor, (the percent of total capacity that is actually used) there would have to be 100 GW of installed CCGT natural gas to provide energy to the present German grid. The plants would occupy about 340km^2 of land, about 0.1% of Germany.
The installation cost of this CCGT is estimated at USD $1020.00/kW, fuel cost at $0.0164/kWh and operating and maintenance costs at $12.20/kW.year. Calculating with an expected 40 year life span for the plant, the total cost of the system would be $726 billion over a 40 year period, which calculates as $0.029 for each kiloWatt.hour produced, but allowing for unprofitable surplus capacity and lower load days, the wholesale costs would be about $0.036/kWh. It is gratifying that my calculation of this levelized cost of electricity is close to other more expert estimates.
So the limbo bar is set at $0.036/kWh wholesale or less than 4¢/kWh. Can ‘zero carbon’ solar and wind electricity slide beneath?
In part 2 of this article I will look at electrical grid solutions for both wind and solar.
