
Putting the BC Covid Epidemic in Perspective
R. McCarter M.Sc
When is an emergency truly an emergency?
When is an emergency so severe that we need to suspend our Charter of Rights and Freedoms?
Is the Covid epidemic so life-threatening that we need to suspend free speech, freedom of association, freedom of travel, the right to make our own health decisions and even the right to our own thoughts?
Are the Covid mandates subject to debate from elected representatives, or are they the capricious whims of unelected health officials?
Recent polls suggest that up to 80% of Canadians approve of vaccine mandates, the coerced injection of experimental vaccines that have dubious efficacy and safety. However large the majority, democracies should not work by plebiscite nor should they follow the decisions of unelected bureaucrats.
That’s why we elect the best and brightest to represent us, knowledgable citizens who weigh the pros and cons, argue and vote to make the tough decisions. These are elected officials who know that government is there to protect the disadvantaged, to give everyone equal rights before the law and to prevent a tyranny of the majority. Elected citizens who know that Canada is bound by agreements like the Nuremberg Code and the Helsinki Accord to protect the rights of all people. Politicians who know that Canada has its own Charter of Rights and Freedoms, the immutable birthrights of Canadians.
Well, it’s a nice dream.
When is an emergency truly an emergency? I cannot make that decision for you but I can present the evidence for the dangers of the Covid epidemic here in British Columbia that will allow you to make the decision for yourself.
I have produced several graphs of Covid data that are freely available from the British Columbia Center for Disease Control BCCDC, StatsCan and the BC Coroner’s Service.
The first graph is typical of the way Covid cases, hospitalizations and deaths are presented in the BCCDC reports:

To the unwary observer following the hills and valleys of this year’s cases, hospitalizations and deaths up to October 05, 2021, it would look like a large number of people infected with Covid end up in hospital and a large number of these die. But of course you have to read the scale to the right of the graph and realize that the scale has been expanded 10X. The plots for hospitalizations and deaths are ten times larger than they should be to compare with the number of cases, the correction would put the deaths plot so low as to be almost indistinguishable from the zero base line.
Is this distortion intentional, an attempt to keep the fear index pegged? Or is it just math geeks being statisticians and saying “of course you check the scales”?
But what groups are most affected by Covid? Surely it is important to establish whether your age makes you more vulnerable or not. Here is the money graph from the BCCDC:

Ok, hospitalizations to the left, deaths to the right, different scales, confusing dates, age groups rising and falling. Perhaps you fancy a graph like this but I prefer a graph that is quick and simple to interpret.
I hope my graphs are clearer, they are all histograms plotted for age groups. The first is a graph of the number of Covid cases identified over the 620 days of the Covid epidemic to October, 05 2021, compared to the population of British Columbia, broken into age groups.

The full height of each bar is the number of BC residents in that age group. Reading the graph there are about 200,000 BC residents who are between 80 and 89 years old, there are almost 800,000 residents between 30 and 39 years old. The small blue sections at the tops of each bar represent the number of Covid cases that have been identified in each age group.
It seems that only a small portion of BC residents have been exposed to Covid, however, it is important to note that not all cases are symptomatic. Many residents may have been exposed to Covid, had no or modest symptoms and were not reported as cases.
It is presumed that the people who have recovered from Covid have a strong natural immunity to a second infection. To my knowledge, there have been no widespread or ongoing studies to determine the proportion of the BC public who have natural immunity.
The next graph takes those cases (blue) in the above graph and expands them to show the number of hospitalizations, ICU treatments and deaths:
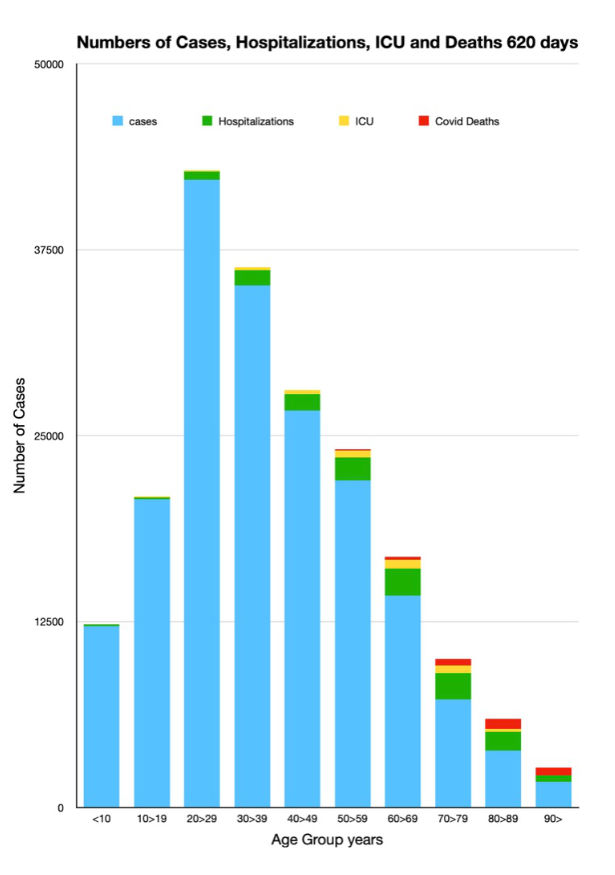
Remember from the first graph that cases were a small proportion of the BC population, now in this expansion you can see that hospitalization (green) and ICU (yellow) patients are a small proportion of a small proportion until we get to ages greater than 60, Deaths are almost nonexistent until age 50 and are an increasingly larger proportion of older age groups,
Deaths of course are the ultimate problem and the following graph shows the percentage of the people in each age group who have died from Covid:
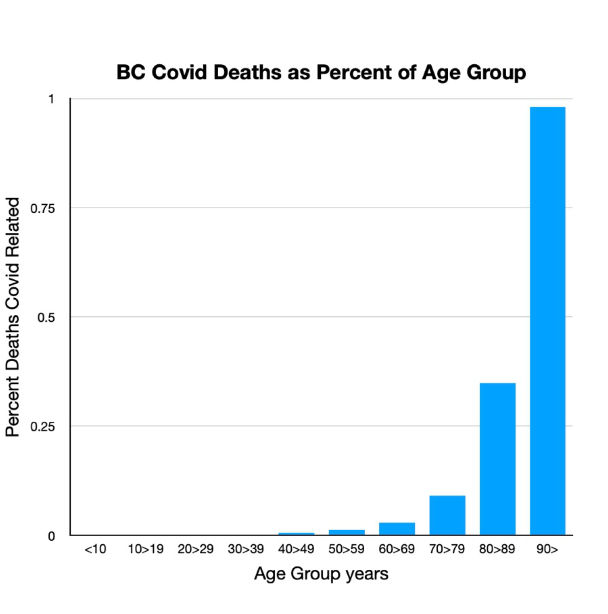
Although the size of the bars may seem alarming at first, note the scale on the left axis of the graph. The scale goes from 0 percent up to 1.0 percent. The graph has been expanded 100X. Over a period of 620 days, going on two miserable years, very few people have died under the age of 70. Even for those septuagenarians and octogenarians the deaths have been a fraction of one percent. The ninety year olds are taking the brunt of Covid with a 620 day mortality of slightly less than one percent of their population.
It is a sad fact of life that people die and there is therefore an expected death rate. Using StatsCan data on BC mortality I worked out the following graph of expected mortality for each age group and superimposed the Covid death rate on the histogram bars.

The green bars represent the expected deaths over a 620 day period. Thankfully there are few deaths in those under 20 and then a progressively increasing number of deaths as we age. Most people die in their 70s and 80s, and the number of expected deaths drops in the 90s. The decreased number of expected deaths in the 90s is because there are far fewer people who reach their 10th decade.
Look closely and you will see the blue bars superimposed on the bottom of the green bars. These are the 620 days of covid deaths. It is this horror that has caused us to mask, lockdown, socially distance and treat others like pariahs as we strip our own Rights and Freedoms.
Notice again that there are very few Covid related deaths under age 50 but then the argument becomes:
“Every life is precious! Shouldn’t we do whatever it takes to save even these few lives?”
To quickly and compassionately agree would throw out any understanding of cost/benefit analysis, that social Newtonian concept that “every action has an unequal and unexpected reaction”.
Take a look at our other BC health crises compared to Covid:

It is apparent that both suicide (green) and drug overdose (red) are more common in BC residents over age 20 and under age 70 while Covid (blue) mainly claims people over 60 years old. I calculate that the average age of the BC population is about 42.9 years old. The average age of people committing suicide is a little higher, about 48.2 years while the average age of overdoses is estimated at 44.0 years.
The average age of those dying from Covid is much higher, I calculate 80.9 years old. This is slightly lower than the normal life expectancy of BC residents of 82.4 years.
The differences in life expectancy suggest yet another graph, the number of person-years lost from Covid compared to the number of person-years lost by suicide and overdose. Person-years lost is determined by calculating the total loss of years of life for those who did not reach the normal life expectancy 82.4 years.
To make sure that the values are comparable, the person-years lost are calculated only for those people under 80 years old.

Loss of person-years allows us to compare the costs of health tragedies, In this example, suicide has 3X the impact of Covid on those under 80 years old and overdoses have 11X the impact. This may seem counterintuitive if you have formed your perspective from the deluge of media coverage on Covid, the shortage of reporting on suicide and the irregular articles on overdoses.
If you have been tuned to the main stream media, you have been subjected to a relentless, 24/7, whenever you turn on the TV, wall to wall coverage of first this premier, then this health minister, followed by umteen health officials. Gripping Covid porn.
After nearly two years of assault, where the objective seems not to inform but to terrify, is there no wonder you have a distorted view on the dangers of Covid? Has this disorienting assault been intentional, has it been to protect you, reassure you, or to manipulate you?
Fear is a powerful method of control, getting you to happily surrender your critical decision making, relinquishing your own mind to opaque, vested groups that could only have the best of intentions.

Leave a comment